Home-Lab Observability with OpenTelemetry

In this post, I will walk you through the Observability setup I am using form my home-lab. The full infrastructure setup is explained in this blog post, and available on GitHub. In this post, we will zone-in on the observability configuration and tooling.
We will conduct this exercise top-down, and focus on the key questions (“Monitoring Objectives”) we want to answer about our services in the order of importance, and briefly comment on the implementation details and open-ends.
As you will see, the presented setup is highly over-engineered for the set purpose. I use the Home Lab systems as a toy use-case to try out a variety of open-source technologies and vendor products. At the end we discuss our learnings ad highlight some of the existing gaps in the ecosystem we experienced along the way.
Outline
Architecture evolves around the OpenTelemetry Collector
My home-lab setup consists of around 20 containerized services that are running on a single host (NixOS/Systemd). Containers are managed with docker-compose. Web services sit behind Traefik as ingress proxy which routes requests and terminates TLS. More details can be found in this blog post.
The central hub of the telemetry collection setup is the OpenTelemetry Collector.
OpenTelemetry is a industry standard, that is bridging across a large number of vendors and open source tools and covers all three telemetry pillars (logs, metrics and traces). The OpenTelemetry Collector is a general data-broker, that accepts telemetry from a large variety of sources (aka. receivers) and is able to forward telemetry to a large variety of telemetry backend systems (see exporters).
In our configuration, the collector accepts metrics, logs and traces in various formats and exports telemetry data to three telemetry backends:
- Self Hosted Backends - Consisting of Prometheus, Loki, Jaeger and Grafana services (config).
- LightStep - Free community account
- Grafana Cloud - Free trial account
The architecture is visualized in the following diagram:
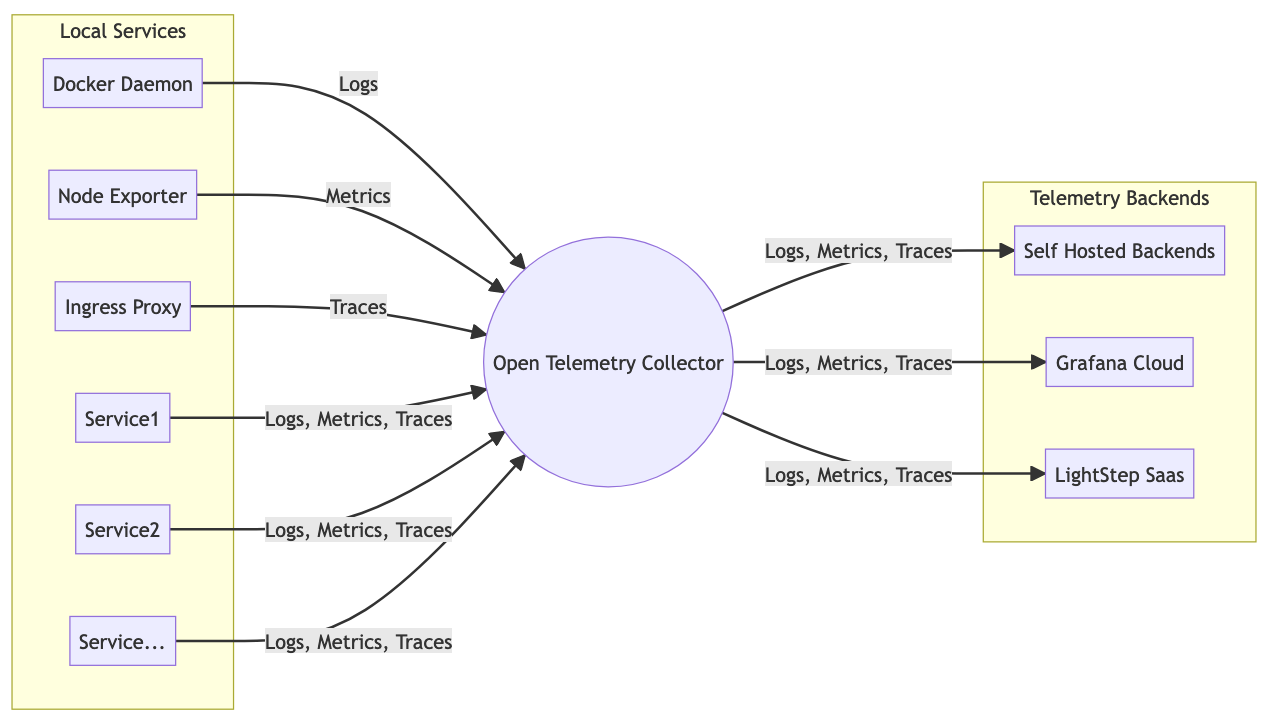
Telemetry Collection Architecture*
*) The metrics part of the architecture diagram is still aspirational, see comments below.
By putting the OTel collector in the center, we gain the flexibility to switch telemetry backends quickly. For example, on-boarding LightStep as telemetry backend took only four lines of configuration. Without OpenTelemetry on-boarding a new vendor required to deploy new agents across all hosts and changes to configuration of all services.
Self-Hosted vs. SaaS as Telemetry Backends. Key benefits of outsourcing telemetry backends include: (a) Telemetry systems remain accessible even when all self-hosted systems go down. (b) Operating telemetry backends is already a quite complex tasks, that distracts you from operating the services that deliver direct value for your users. I was happy to learn that both Grafana Cloud and LightStep accounts are fairly generous when it comes to usage quotas. I know that more vendors offer similar free-tier services, and I plan to expand this experiment in the near future.
Monitoring Objectives
Service Availability with Synthetic Probing
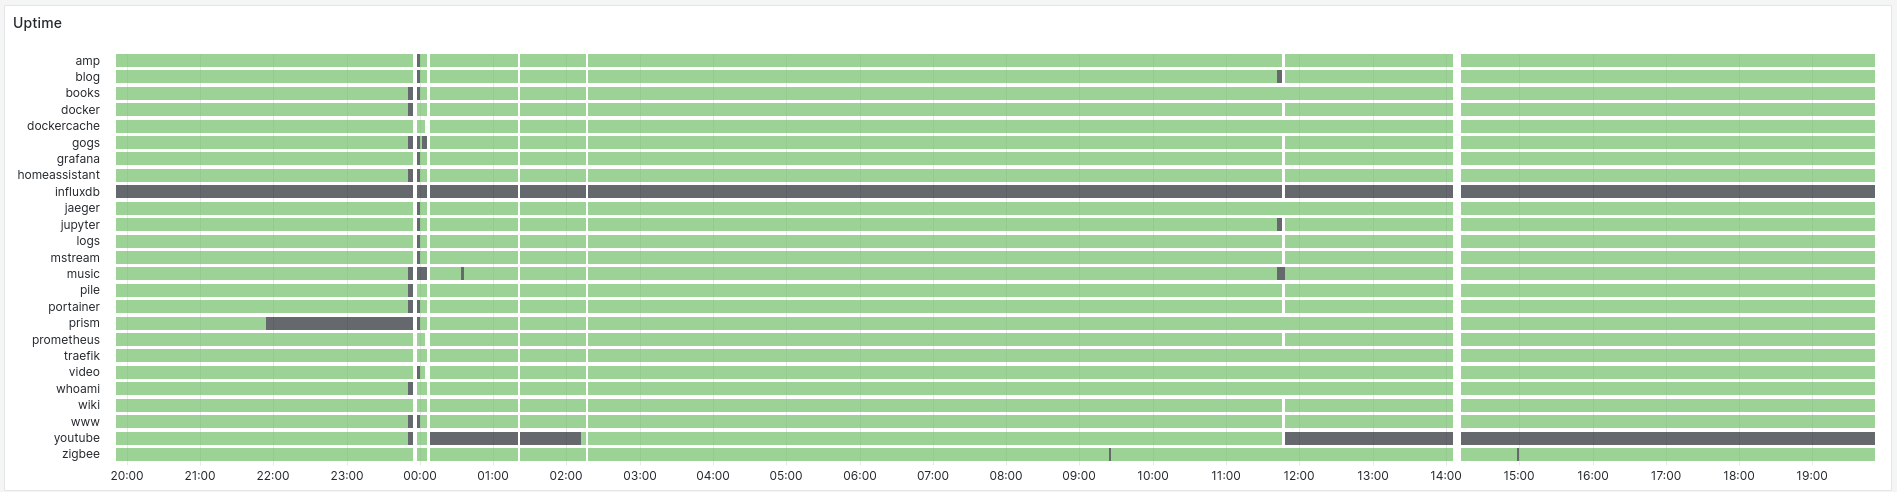
This is probably the most important question any telemetry system has to answer. Since my services rarely serve any requests, we can not rely on organic traffic to control availability. Instead we probe each HTTP API every 15 seconds, and see if I get back a 200 OK (or 401 Unauthorized) response. For other services (e.g. samba), I check that a TCP connection can be established.
Implementation
- Service endpoints are discovered form the local configuration with a cron job that scans docker-compose and keeps a config file up to date.
- Prometheus + Blackbox exporter are used to probe all the APIs listed in the file.
- Grafana “State Timeline” panel is used for the final visualization.
Open Ends
-
Prometheus metrics actually do not go through the OTel collector at the moment. Surprisingly there is no good way to send metric data from Prometheus scrapers to an OTel Collector. Instead, the official solution is to collect the metrics directly with the OTel collector.
-
Deploy a second probing location to get a look from the outside. As all services are only exposed on a trusted network (VPN, LAN) we can’t use SaaS tools for this, but need to deploy another Prometheus instance on the network.
Host Availability with Node Exporter
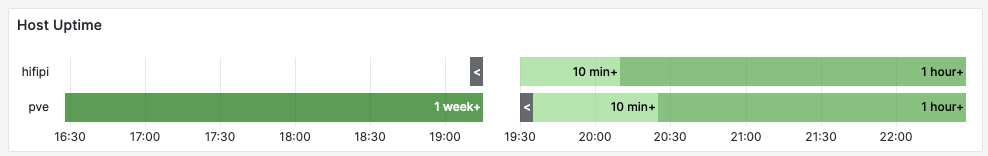
The system we are monitoring has a single point of failure: THE host, where everything is running (“pve”). This simple panel shows the total uptime of the host, together with a bar plot that makes restart, and gaps in data collection easy to spot.
Implementation
- We use the Prometheus Node Exporter to collect uptime statistics (config).
- Visualization uses a “State Timeline” Grafana Panel.
Network Connectivity with Blackbox Exporter

A machine that is “up” is only useful if it’s available on the network. We keep track of local connectivity by probing the local router, and public DNS servers on the internet every minute.
Implementation
- Network connectivity is monitored with the blackbox-exporter that sends ICMP “pings” to the respective hosts (config).
- Visualization uses a “State Timeline” Grafana Panel.
Container Logs with Loki
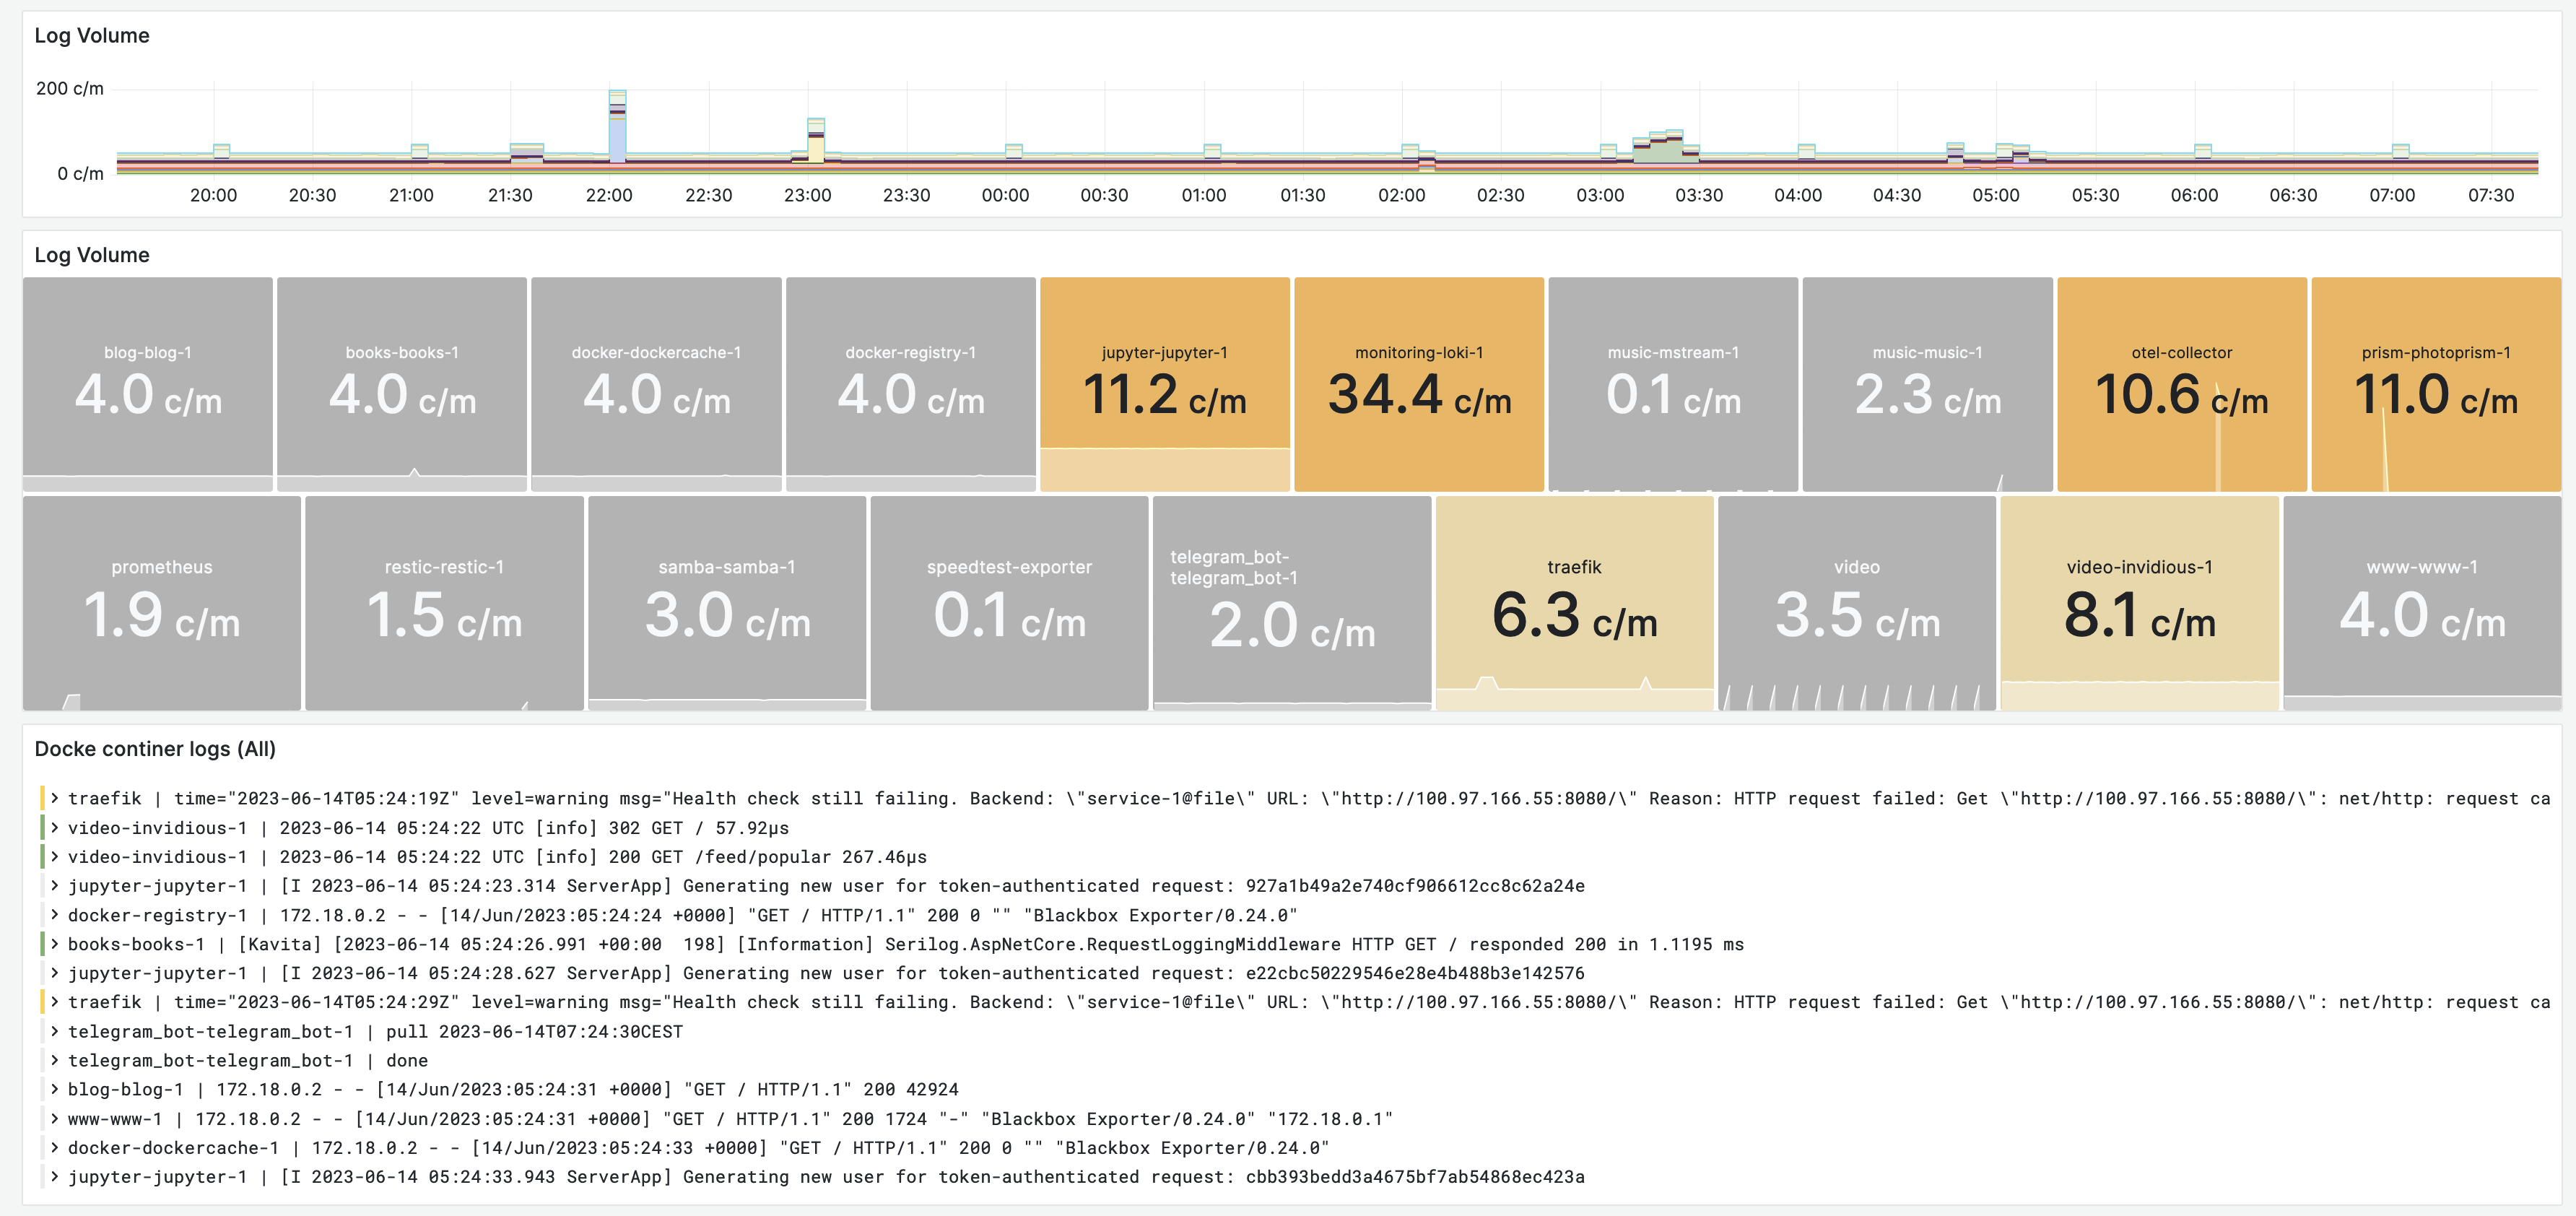
The panel on the top shows the total log volume across all containers. The middle panel breaks the log volume down per container. The listing below the graph, shows the actual logs.
Implementation
- Logs are exported by the docker daemon using the fluentd log driver as configured here
- The OTel collector has a fluentd receiver configured and forwards this logs to Loki
- Loki is used for storage and retrieval of logs
Findings. Containers should not be emit many logs during normal operations. There may be some logs for life-cycle events (restart), or periodic cleanup tasks. The color coding reflects this ideal. A few containers are logging more than 10 log lines per minute, this is indicative of a problem or misconfiguration and should be investigated.
Open Ends
- A Live trail function is missing.
RED Metrics via Tracing
More specifically, we care about: The request rate, the error rate and the duration of those requests. These metrics are known as the 3 Golden Signals (there is a 4th one: saturation) or “RED” Monitoring.
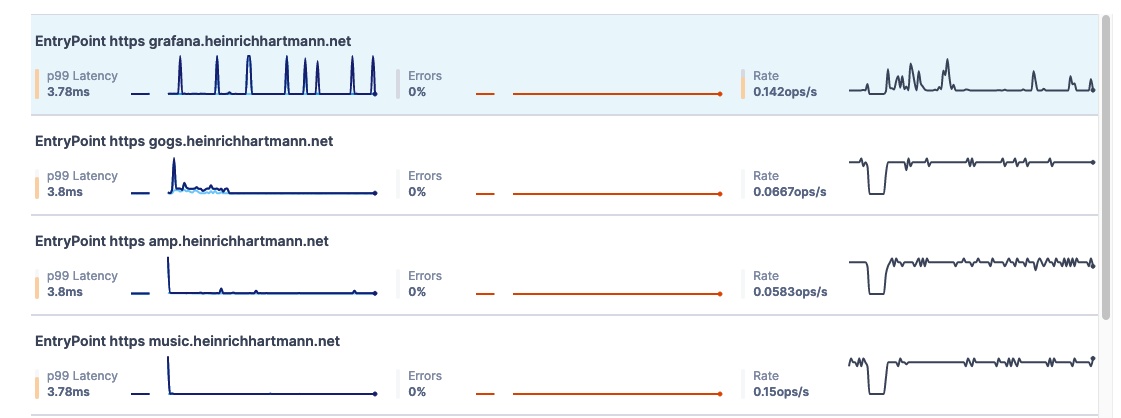
Implementation
- We are collecting tracing data from the ingress proxy traefik (config).
- Data is received by a Jaeger receiver of the OTel collector (config) and forward to tracing backends.
- The screenshot above is taken from the LightStep UI (“Key Operations”). LightStep provides this functionality out of the box, without any further configuration.
Open Ends
- Integrate RED-metrics into the main Grafana dashboard.
Sadly, the Jaeger tracking backend does not have the ability to calculate RED metrics form the stored spans on the fly.
Alternative approaches include:
- Using the Grafana Tempo Tracing backend, which supports TraceQL.
- Use the OpenTelemetry collector to generate RED metrics in transit with the SpanMetrics Connector.
Access Logs via Tracing
Which URLs are being called? Which HTTP methods are used? Which return-codes are returned? …
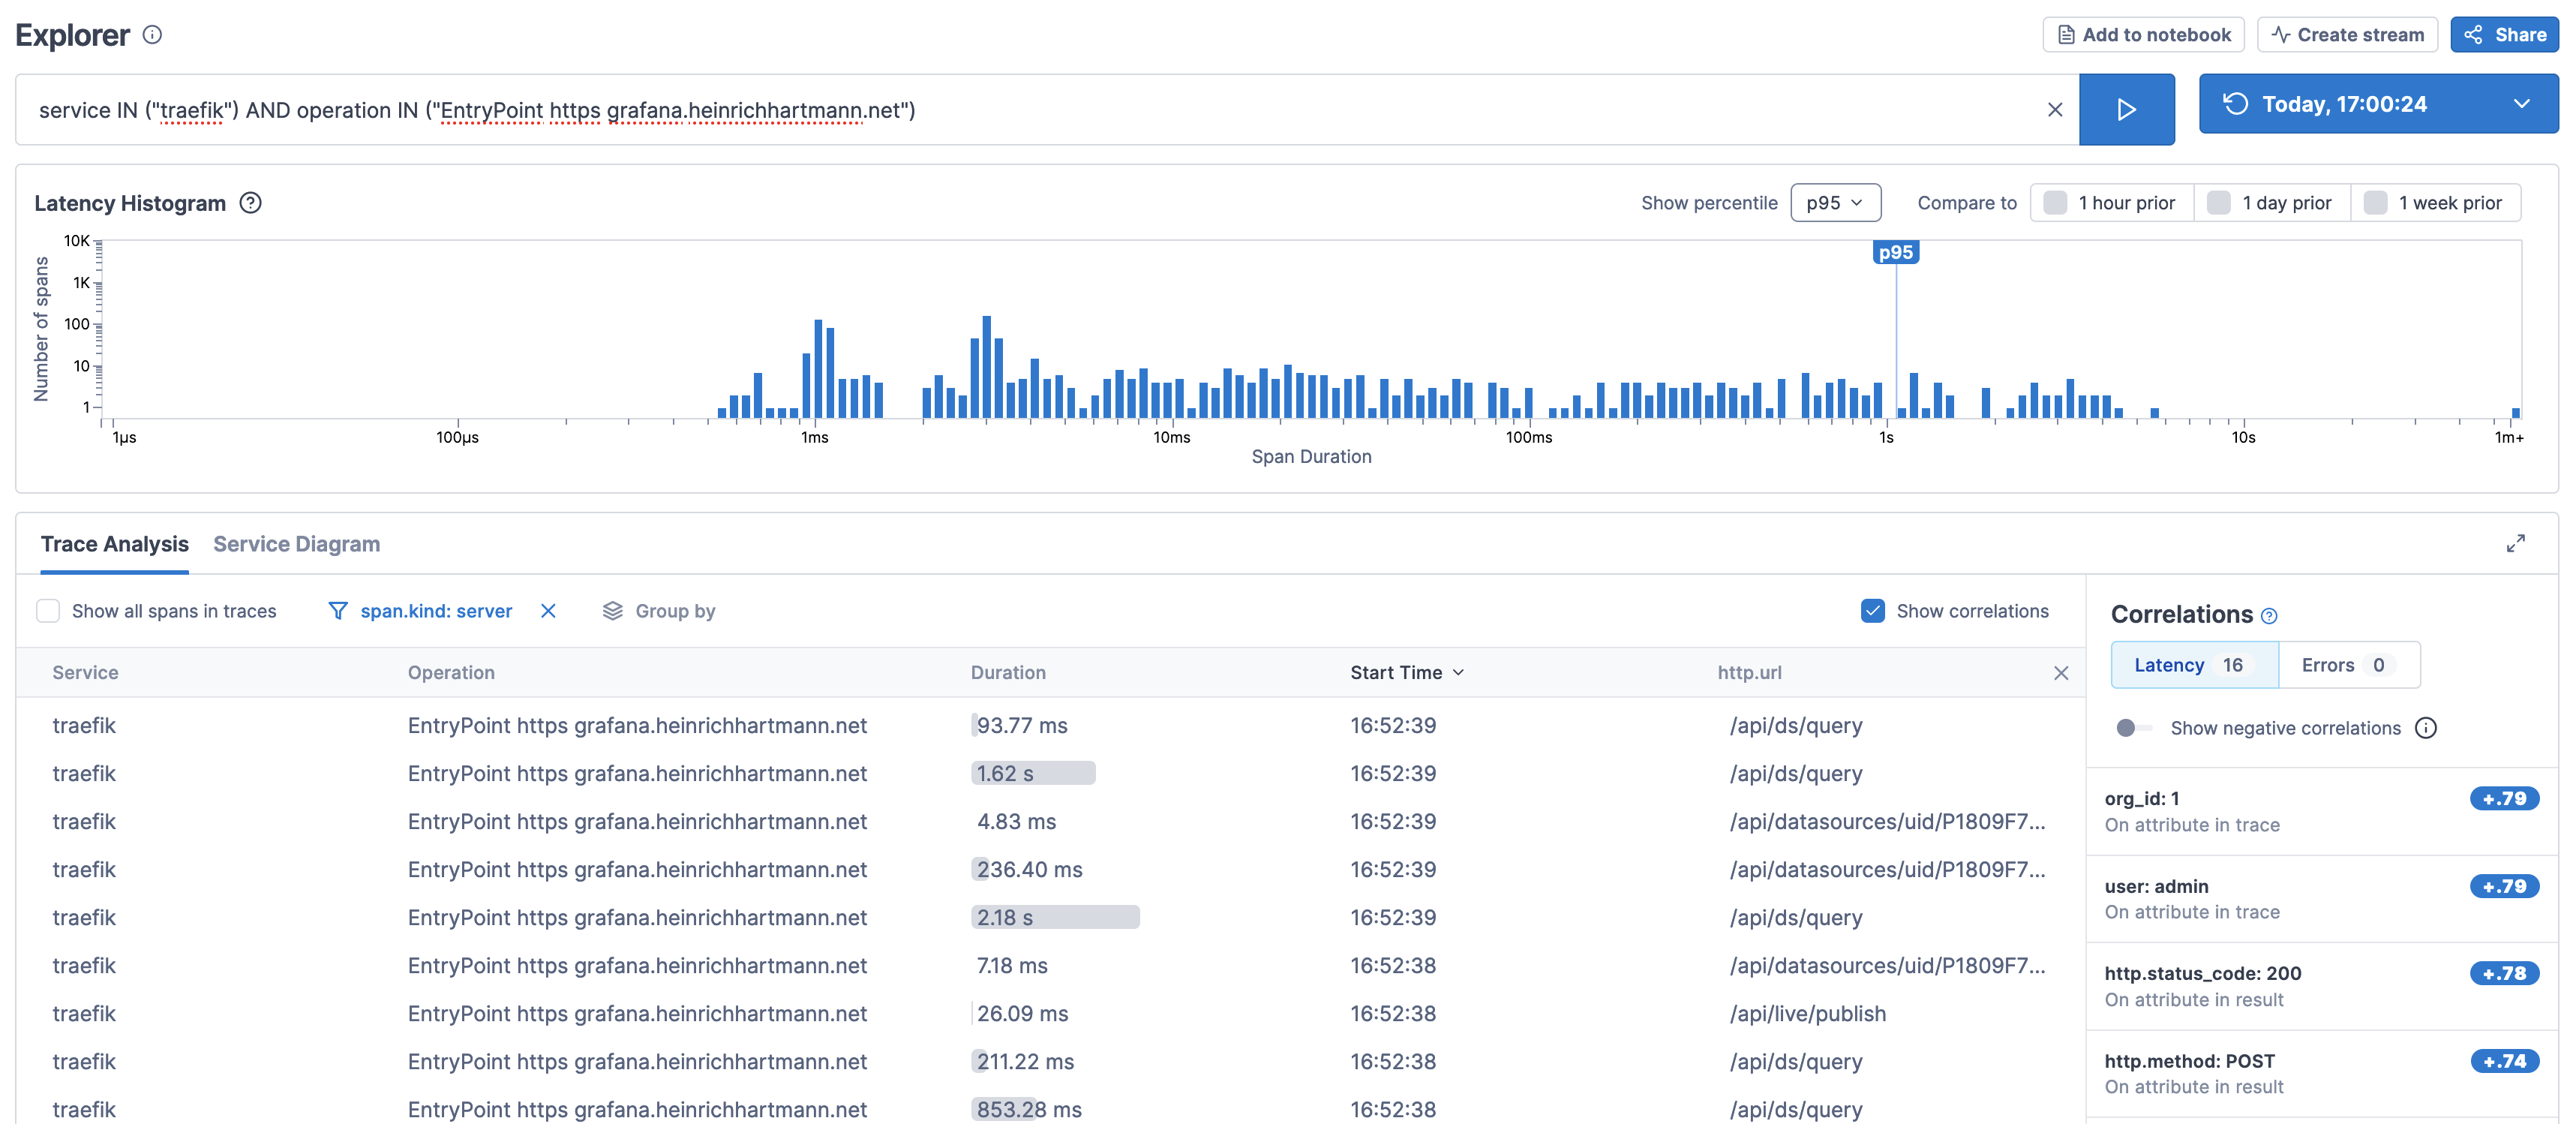
Implementation
Traditionally this is solved by access logs. With the advent of Tracing we have much more potent technologies at hand, that cover access logs as a special case and avoid the cost and performance risks associated with indexing access logs in logging systems.
- The screenshot above is taken from the LightStep UI using the Explorer function.
Open Ends
- Surprisingly, none of the open-source tracing backends that I tried (Jaeger, Tempo) seem to cater to the access log use-case. Ideally I would like to have a “Access Log Tail” widget on a Grafana Dashboards, that gives me a live view about what requests. The closest I was able to get to this, is the LightStep Explorer view I presented above. There are ways to convert traces to logs in-flight, but those are not straight forward and result in us storing access logs in the logging system.
- The LightStep UI does only allow to show a single additional attribute in the table (e.g. “URL” or “return code”), also we have to re-build this view every time we want to use it.
- It would be great to have access log information for TCP services (like samba) as well.
- Tracing could be much more powerful, than just providing access logs. From the ~20 services I run internally only one (Grafana) provides internal spans about the interactions.
Container Resources with cAdvisor
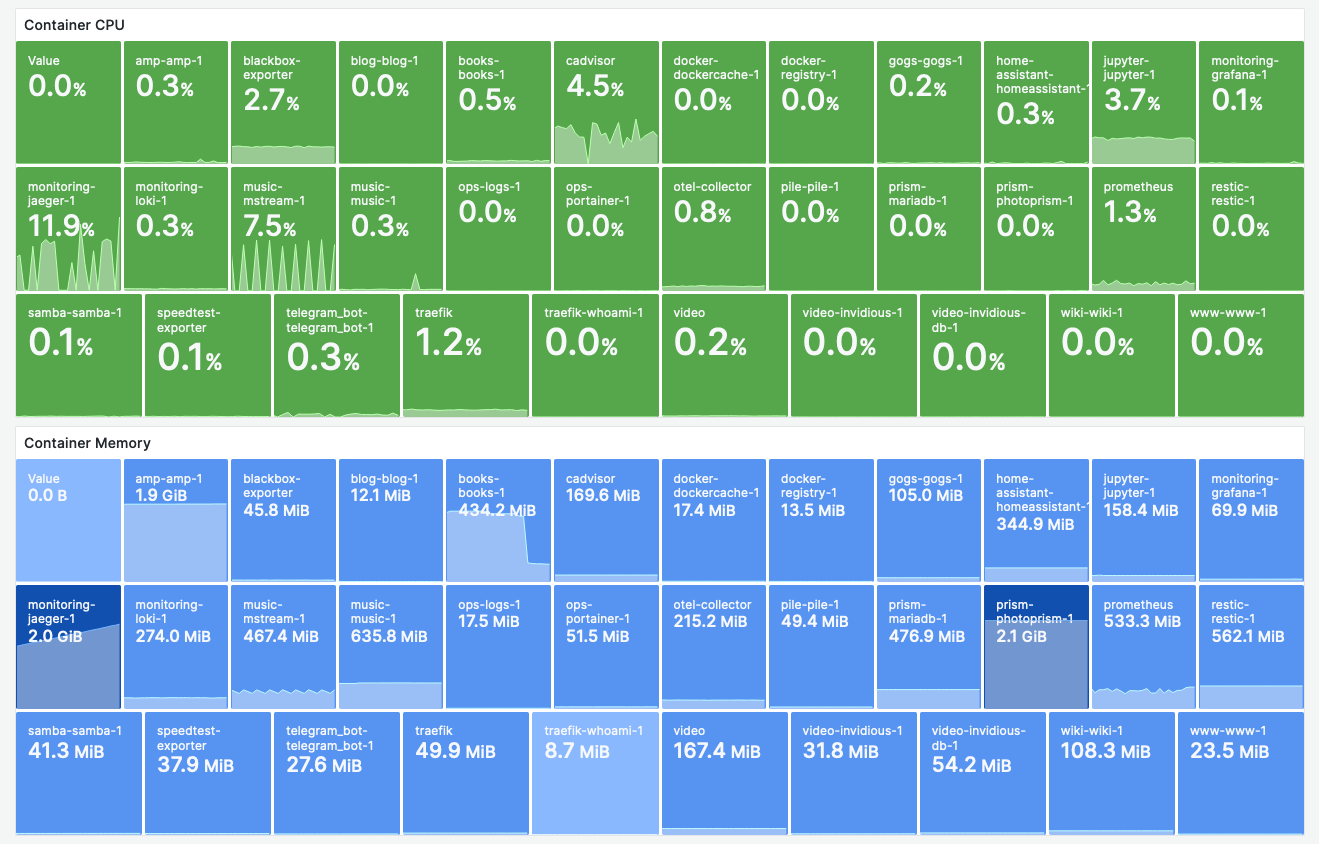
Implementation
- We collect resource utilization data from cAdvisor and use a Grafana “Stat” Panel to visualize the data.
Findings
-
The CPU utilization of cAdvisor is a constant offender. In an idle state, I don’t want to have more than 1% CPU utilization, cAdvisor floats at ~4%. This is after applying the optimizations I found on the internet.
-
CPU + Memory consumption of Jaeger needs to be investigated.
Host Resources with Node Exporter
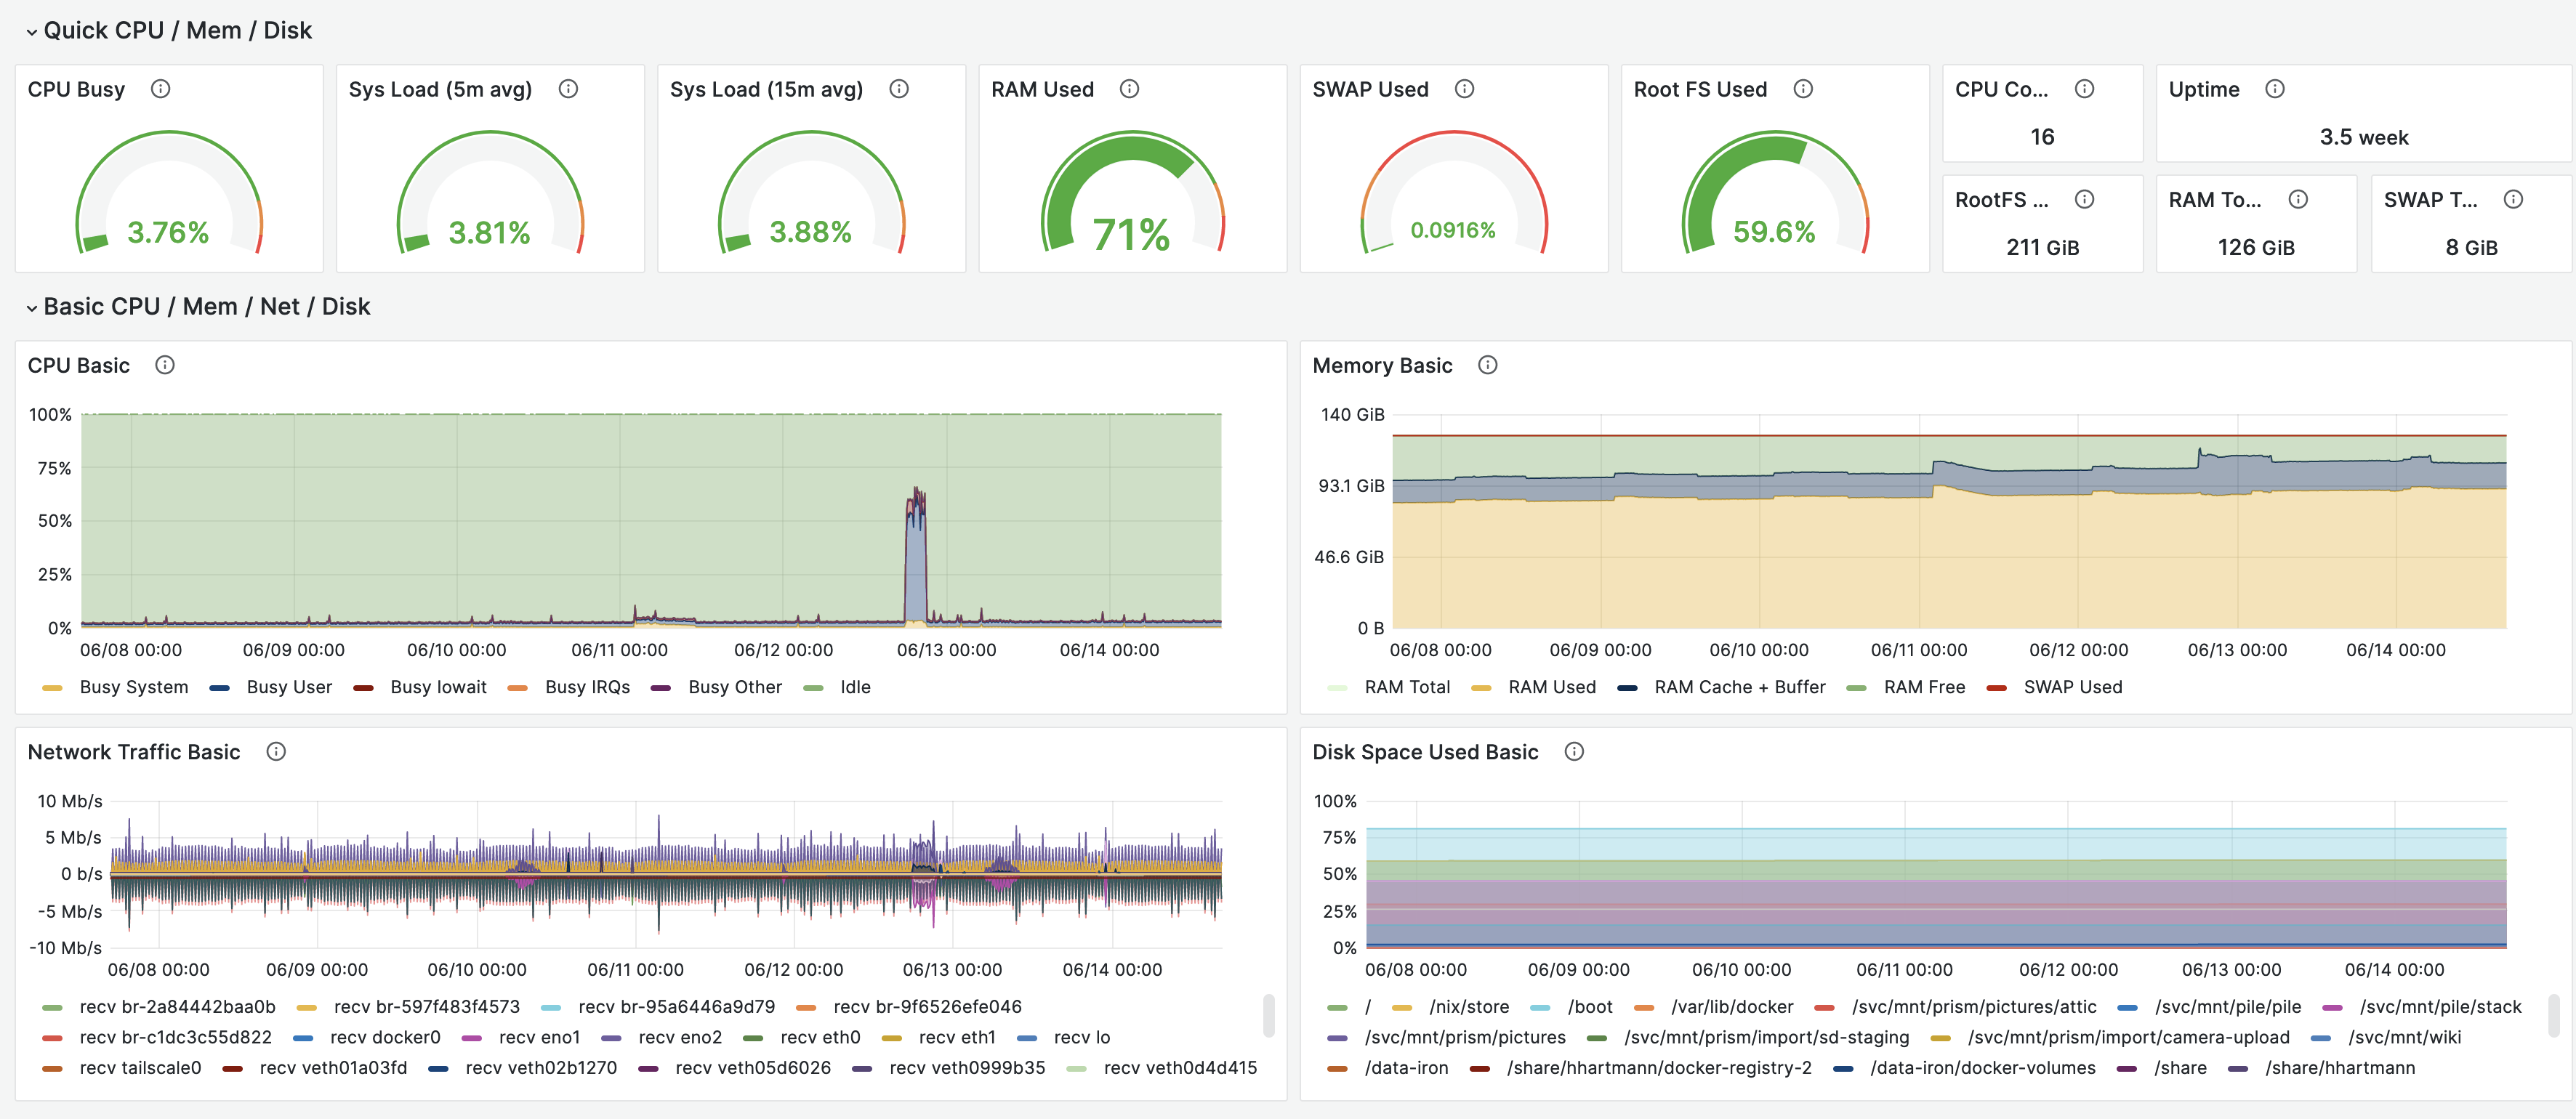
Implementation
- This dashboard uses the Prometheus Node Exporter, and the Node Exporter Full dashboard.
Open Ends
- A few years ago, I engineered the default System Dashboard for Circonus. This dashboard embraces the USE-Methodology by Brendan Gregg to keep an eye on all relevant resources. The existing Node Exporter dashboard focuses on utilization metrics, and misses out on saturation and error metrics, that would be interesting in this contest.
System Logs with Fluentbit and Loki
While we strive to have all services containerized, there are inevitably some parts of the system, that are better run outside of containers. Examples include the Linux kernel itself, the docker daemon, Tailscale as well as data-collectors for the host: Node Exporter and Fluentbit.
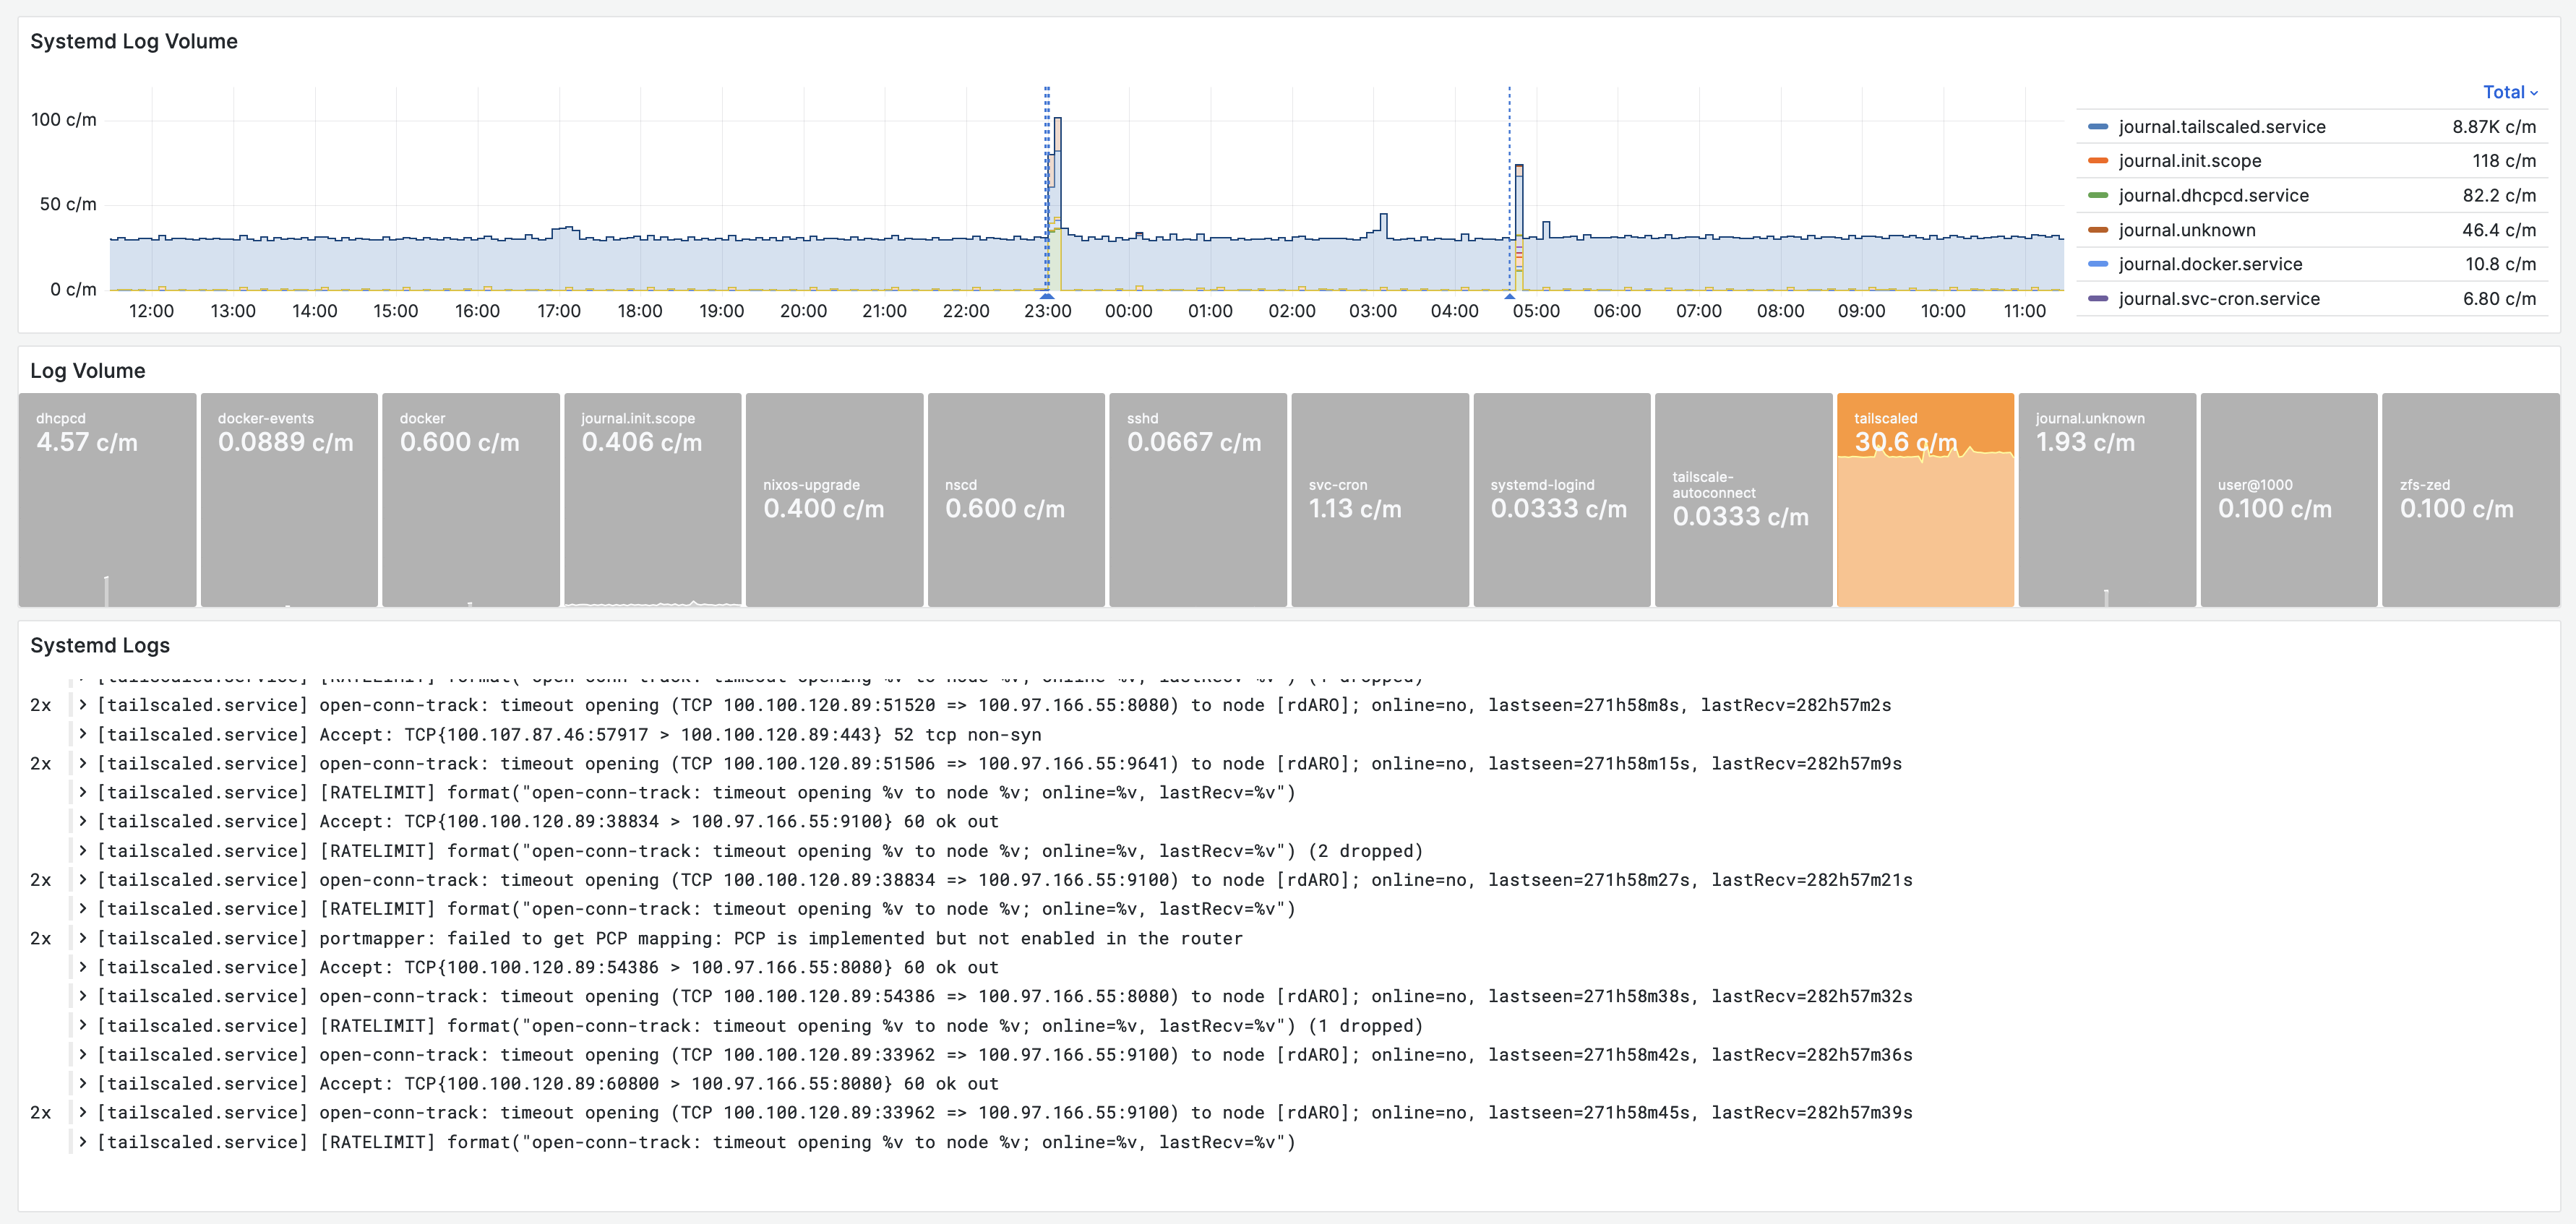
Implementation
- Logs are collected with Fluentbit running as Systemd service (config). The remaining steps are similar to the container log dashboard.
Findings
- Tailscale is a little chatty. This should be looked into.
Network Monitoring with ICMP Probes
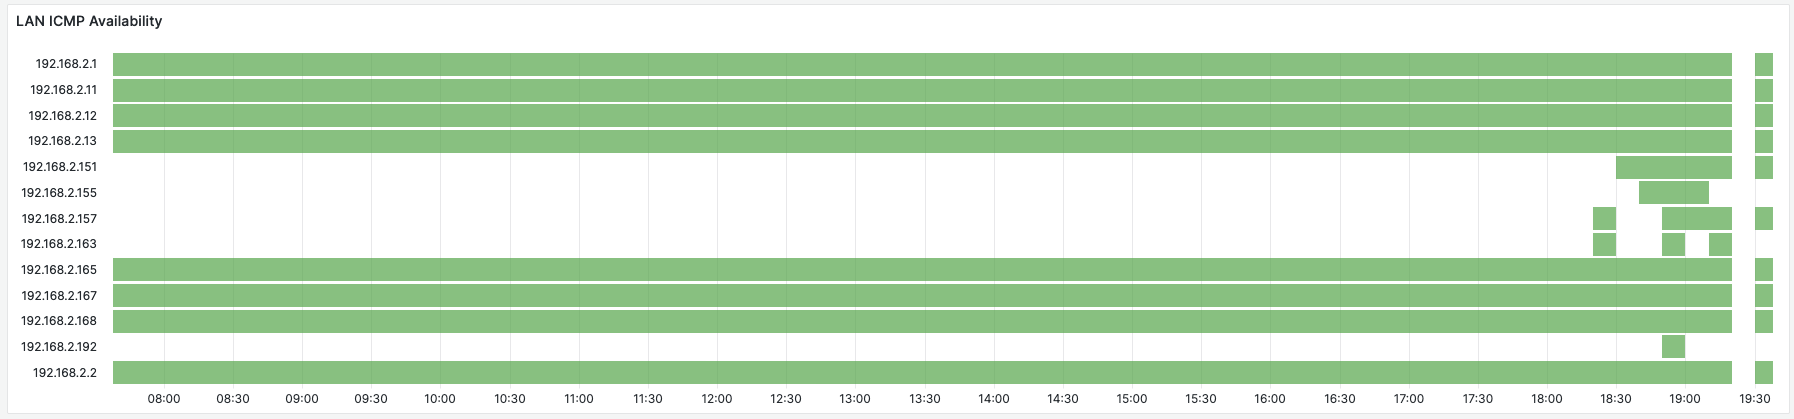
This panel, that shows the availability of all 256 IPs in my /24 LAN. When debugging issues with gear deployed on the network (printers, routers, etc.) it bis useful to know which devices have been available on the network at which points in time.
Implementation
- Prometheus blackbox-exporter/ICMP module is configured with a static list of all hosts in the network (config).
- Visualization uses a Grafana “State Timeline” Panel.
Open Ends
- Sort the entries in the panel. (Who knows how to do this? Did not find a solution online.)
Conclusion
Building out this home-lab observability setup, has been a great learning experience for me. I deepened my knowledge of established technologies like Prometheus and Grafana, and got to play with some newer tools, like the OpenTelemetry collector and LightStep.
One major take-away for me is, the great flexibility that the OpenTelemetry collector is giving us for plumbing and evolving the telemetry setup. On-boarding a new data-source, or a telemetry backend is a matter of minutes. This is particularly interesting for trying out various SaaS backends or database technologies, and makes it possible to on-board specialized solutions for more advanced use-cases (e.g. for anomaly detection on selected metrics). I greatly enjoyed playing with free Grafana Cloud and LightStep accounts in this controlled setting and plan on trying out other SaaS vendors as well.
I also ran into a number of gaps in the current setup, that I was not able to close quite yet. These include getting access logs from traces into Grafana, generating RED (rate, error, duration) metrics from traces, and forwarding metrics from Prometheus to the OTel collector.